Using Global Mangrove Watch to prioritise blue carbon conservation action
-
Global Mangrove Watch
Global Mangrove Watch user story
The Global Mangrove Watch (GMW) is an online platform that provides remote sensing data and tools for global monitoring of mangroves. Niharika Iyengar from Wetlands International interviews Jennifer Howard, Vice President of the Blue Carbon Program at Conservation International (CI) on how she is using Global Mangrove Watch.
For the last decade, Conservation International has been laying a lot of the groundwork for high-quality, verifiable blue carbon programs. Jennifer works with CI’s country programmes to develop blue carbon project pipelines. Together, they identify where the best opportunities are and conduct a range of assessments to guide funding opportunities.

Q: Can you explain blue carbon for the layman?
Blue carbon refers to the carbon stored and sequestered by coastal ecosystems like mangroves, salt marshes and seagrass. When these ecosystems are destroyed, you not only lose the plant carbon itself, but the carbon stored in the soil can emit for decades after. Unfortunately, once that soil carbon is lost, it is irrecoverable.
Q: How have you been using Global Mangrove Watch?
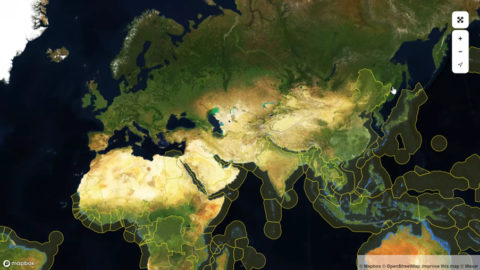
A: I personally use GMW as a first, high-level tool to find areas where there’s been a lot of mangrove loss in recent years, especially in countries where we are trying to implement a blue carbon program. Maps are an important communications tool and I think GMW does well to show high-level data quickly and in an easy-to-understand way.
Q: What are GMW’s current limitations for blue carbon programming and how do you solve this?
A: Maps have limitations and local ground-truthing data will almost always be better. What I have found is that for the mangrove layer, GMW is about 75% accurate. I then usually combine this with reports from staff on the ground and another tool like Clark Labs to get to a higher accuracy level. NASA has a cool map where it doesn’t just have presence or absence or net loss, but then what did that loss turn into. Did it turn into open water? A farmland? Or is it just non-productive vegetation? By comparing data from various sources, I can then make educated guesses to the cause of loss and degradation and that informs restoration decisions. Where can we have most effective impact?
Q: What would you like to see in future versions of GMW?
I would love to see a mangrove layer of national maps i.e. maps produced by national governments and GMW meshed somehow. Governments’ reporting to the UNFCCC is based on their national maps so it can be counterintuitive or cumbersome to have two sources of truth.
I’d also love to see some sub-national scale granularity and be able to see actual project sites.
I also know that there’s work being done on a restoration potential map which is very exciting! Combining this with restoration tracker tools and cost data would be very beneficial. That way we’d be able to see if restoration is happening in the areas with the highest potential and how much money would be needed to do this effectively.
Finally, I’d love for there to be a way for national Global Mangrove Alliance chapters to start uploading data – economic, biodiversity or carbon data – for that finer-scale resolution. And we should utilize the national chapters to influence decision makers!
Q: What’s next for you and GMW?
I will continue using blue carbon as an incentive for coastal conservation and restoration, particularly through mitigation and adaptation value that these ecosystems have. I think we’re now at a place where we understand the science, we’ve translated that into actionable items for policy and decision makers, we have the tools, and the political will. Now we must start implementing and scaling these solutions. We need to find locations that have high blue carbon potential combined with rich biodiversity and value to people.
For Global Mangrove Watch, I’d love to see countries that don’t have national maps use GMW as the basis for their planning!
Discover how you can use Global Mangrove Watch
The current carbon layer in Global Mangrove Watch is based on 2016 data, but will soon be updated with 2020 data. As a result, the new layer will inherit improvements, for example the missing areas of mangroves that have been added, like parts of the West coast of India, Togo, Benin, and many small islands in Indonesia and the Philippines. For all these locations carbon data are now available.
Global Mangrove Watch is a free and easy-to-use, and scientifically robust tool for practitioners, governments and investors, in scientific collaboration with Wetlands International, Aberystwyth University, soloEO, TNC, JAXA, NASA and a host of partners. Check out near real-time information on the extent, status and values of mangroves in the country or site of your interest: www.globalmangrovewatch.org