WET HORIZONS: Tools to accelerate wetland restoration in Europe
Last week, WET HORIZONS held its final end-user workshop led by Wetlands International and co-organised by the University of Greifswald and James Hutton Institute. The WET HORIZONS project brings together 14 organisations with the aim to improve wetland knowledge and develop tools to enhance the protection and restoration of Europe’s wetlands. It’s objectives are best depicted in the image below:
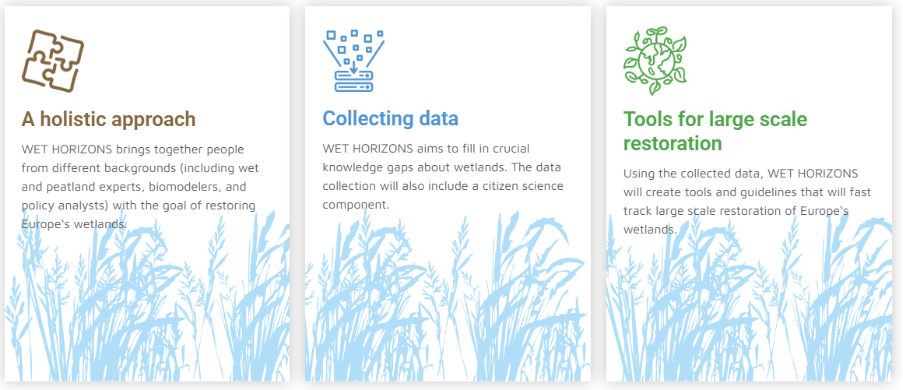
Wetlands International’s task aimed at ensuring that end-users geo-spatial needs would be considered in the development of the data products for wetlands restoration, considering:
- Identify user data needs and requirements
- Co-develop usable products
- Build partnerships and support
- Enable widespread use of tools
In this final edition, participants were shown a few key databases and digital tools that WET HORIZONS aims to deliver by 2026.
Shubiao Wu, Project Coordinator of WET HORIZONS, began with an overview of the project, outlining the various groups including those working on mapping, socio-economic assessment, and wetland policy and governance for a just transition to net-zero. The project is currently undertaking a comprehensive stakeholder analysis and impact planning.
1. European Wetland Map – the most comprehensive map of wetlands in Europe to date
Alexandra Barthelmes of GMC shared one of the earliest outputs of the project – the European Wetland Map. The Map shows Europe’s peatlands, floodplains and coastal wetlands more comprehensively than ever before. Compiled from about 200 data sources, this map informs policy makers, land users and anyone interested in wetlands about the distribution and types of peatlands. Although there is room for improvement, it still is the most comprehensive, openly accessible, map of wetlands in Europe to date. Its usefulness is attested in the fact that it has been downloaded over 14,000 times!
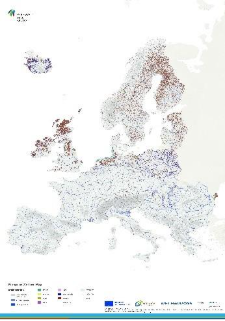
The European Wetland Map:
- Is free to access
- Covers many wetland types including major peatland types
- Provides different resolutions of spatial data
- Provides additional information like drainage data
- Shows the interconnection of floodplains, coastal wetlands, and peatlands
Explore the map here: https://zenodo.org/records/15302184
2. Wetland monthly water table dynamics (2019-2024)
Rebekka Artz and Fraser Macfarlane walked participants through the water table dynamics model, using the European Wetland Map. It is a Machine Learning product that tracks average monthly water table dynamics for 10 catchments across Europe which is a good proxy for other measurements like greenhouse gas emissions in peatlands. This model will be integrated into the Interactive App in the near future.
3. Temporal emissions factors and hotspot mapping
Currently, countries report on their emissions annually to the UNFCCC. As a part of this, peatland emissions are also accounted for by a simple methodology that dates back to 2013. Countries are now adopting more advanced methods which include the Master Dataset for Wetlands GHG Emission Factors (produced as part of the WET HORIZONS project).
However, the data available there are annual static emission factors. What is clear in restored areas is that emission factors also vary in time. These trajectories had never been analysed before. Through WET HORIZONS, Temporally and Spatially Stratified GHG Emission Factors for European Restored Peatlands are now made available.
Combining this data with data available via the water table model, scientists can predict emissions mitigation potential for peatlands across Europe.
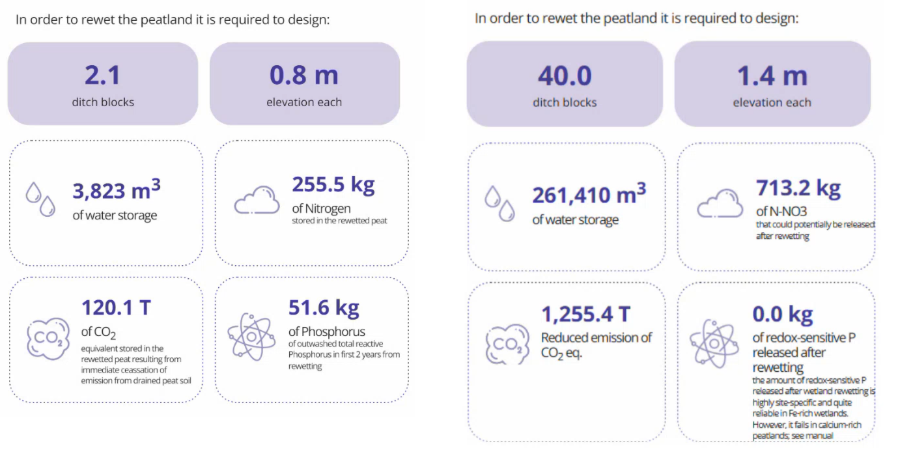
4. Servi-PEAT – quantifying peatland rewetting co-benefits
Marta Stachowicz then walked participants through Servi-PEAT, an online model-based tool that provides a simple way to assess probable water retention, carbon storage and nutrient retention in peatland rewetting actions. It addresses main stakeholder questions like how can we rewet peatlands? How much would it cost? What do we get in return? What could be some trade-offs?
In this example below, a user can compare the outcomes between two scenarios with different number of ditch blocks.
Still to come – WET HORIZONS app
An Interactive App to tie these many features together is in development and due to be completed in 2026 which Rebekka showed a beta mode version of.
The session ended with an interactive session including questions to participants regarding the data and tools showed. Participants highlighted as relevant a further refinement of the Wetlands map for some regions (e.g. S-Europe), promoting broader data availability and information on restoration costs.
To find out more about this project or the tools available, please reach out to Sonia Mena or Niek Schasfoort.